Edit chart
Loading graph
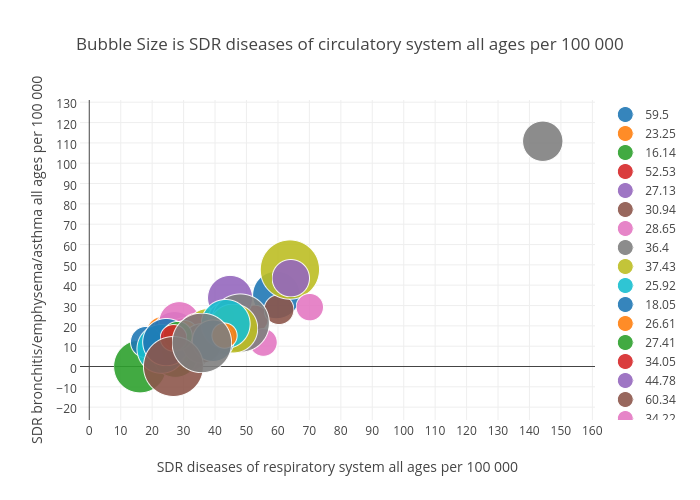
Billatnapier's interactive graph and data of "Bubble Size is SDR diseases of circulatory system all ages per 100 000" is a scatter chart, showing 59.5, 23.25, 16.14, 52.53, 27.13, 30.94, 28.65, 36.4, 37.43, 25.92, 18.05, 26.61, 27.41, 34.05, 44.78, 60.34, 34.22, 144.22, 63.81, 22.94, 24.51, 30.32, 43.13, 42.25, 42.24, 35.85, 55.37, 48.02, 45.8, 43.38, 39.38, 43.02, 28.11, 26.8, 64.09, 26.76, 70.13, 35.8; with SDR diseases of respiratory system all ages per 100 000 in the x-axis and SDR bronchitis/emphysema/asthma all ages per 100 000 in the y-axis.. The x-axis shows values from 0 to 0. The y-axis shows values from 0 to 0.