Edit chart
Loading graph
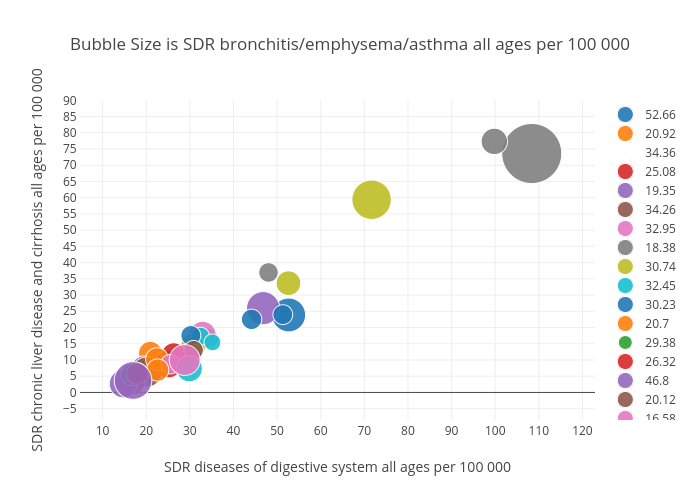
Billatnapier's interactive graph and data of "Bubble Size is SDR bronchitis/emphysema/asthma all ages per 100 000" is a scatter chart, showing 52.66, 20.92, 34.36, 25.08, 19.35, 34.26, 32.95, 18.38, 30.74, 32.45, 30.23, 20.7, 29.38, 26.32, 46.8, 20.12, 16.58, 108.38, 71.66, 35.17, 51.31, 22.47, 16.5, 16.48, 14.77, 30.88, 25.57, 99.8, 52.6, 29.86, 44.15, 22.61, 16.72, 17.94, 16.97, 50.13, 28.82, 48.03; with SDR diseases of digestive system all ages per 100 000 in the x-axis and SDR chronic liver disease and cirrhosis all ages per 100 000 in the y-axis.. The x-axis shows values from 0 to 0. The y-axis shows values from 0 to 0.