Edit chart
Loading graph
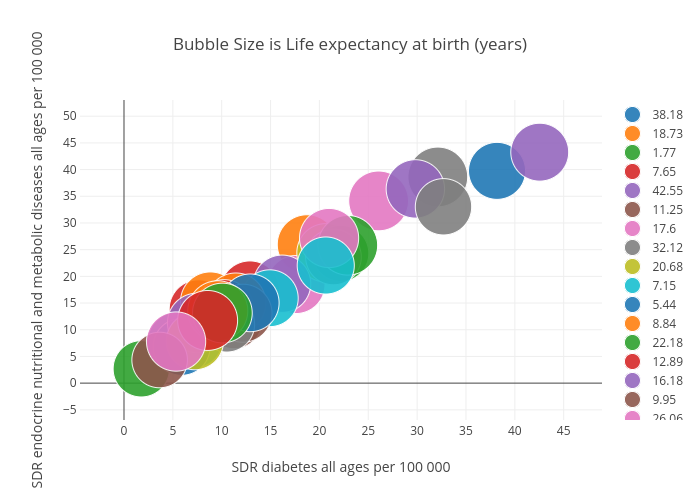
Billatnapier's interactive graph and data of "Bubble Size is Life expectancy at birth (years)" is a scatter chart, showing 38.18, 18.73, 1.77, 7.65, 42.55, 11.25, 17.6, 32.12, 20.68, 7.15, 5.44, 8.84, 22.18, 12.89, 16.18, 9.95, 26.06, 21.44, 13.58, 14.92, 5.9, 11.45, 22.91, 10.24, 7.5, 12.18, 20.99, 10.52, 7.26, 20.65, 12.92, 9.6, 10.07, 8.56, 29.82, 3.65, 5.33, 32.7; with SDR diabetes all ages per 100 000 in the x-axis and SDR endocrine nutritional and metabolic diseases all ages per 100 000 in the y-axis.. The x-axis shows values from 0 to 0. The y-axis shows values from 0 to 0.