Edit chart
Loading graph
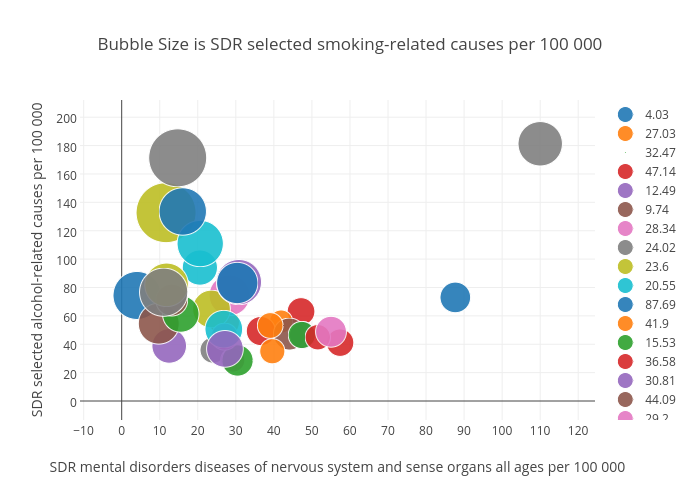
Billatnapier's interactive graph and data of "Bubble Size is SDR selected smoking-related causes per 100 000" is a scatter chart, showing 4.03, 27.03, 32.47, 47.14, 12.49, 9.74, 28.34, 24.02, 23.6, 20.55, 87.69, 41.9, 15.53, 36.58, 30.81, 44.09, 29.2, 110.01, 11.66, 20.64, 16.05, 39.04, 30.45, 57.41, 47.63, 13.16, 27.04, 14.72, 11.8, 26.84, 30.38, 39.59, 47.34, 51.54, 27.14, 15.18, 55.02, 11.03; with SDR mental disorders diseases of nervous system and sense organs all ages per 100 000 in the x-axis and SDR selected alcohol-related causes per 100 000 in the y-axis.. The x-axis shows values from 0 to 0. The y-axis shows values from 0 to 0.