Edit chart
Loading graph
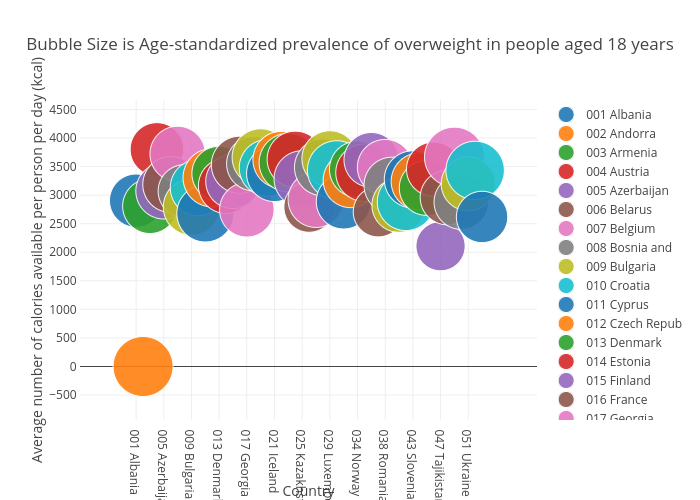
Billatnapier's interactive graph and data of "Bubble Size is Age-standardized prevalence of overweight in people aged 18 years" is a scatter chart, showing 001 Albania, 002 Andorra, 003 Armenia, 004 Austria, 005 Azerbaijan, 006 Belarus, 007 Belgium, 008 Bosnia and , 009 Bulgaria, 010 Croatia, 011 Cyprus, 012 Czech Repub, 013 Denmark, 014 Estonia, 015 Finland, 016 France, 017 Georgia, 018 Germany, 019 Greece, 020 Hungary, 021 Iceland, 022 Ireland, 023 Israel, 024 Italy, 025 Kazakhstan, 026 Kyrgyzstan, 027 Latvia, 028 Lithuania, 029 Luxembourg, 030 Malta, 032 Montenegro, 033 Netherlands, 034 Norway, 035 Poland, 036 Portugal, 037 Republic of, 038 Romania, 039 Russian Fed, 041 Serbia, 042 Slovakia, 043 Slovenia, 044 Spain, 045 Sweden, 046 Switzerland, 047 Tajikistan, 048 MKD*, 049 Turkey, 050 Turkmenista, 051 Ukraine, 052 United King, 053 Uzbekistan; with Country in the x-axis and Average number of calories available per person per day (kcal) in the y-axis.. The x-axis shows values from 0 to 0. The y-axis shows values from 0 to 0.