Edit chart
Loading graph
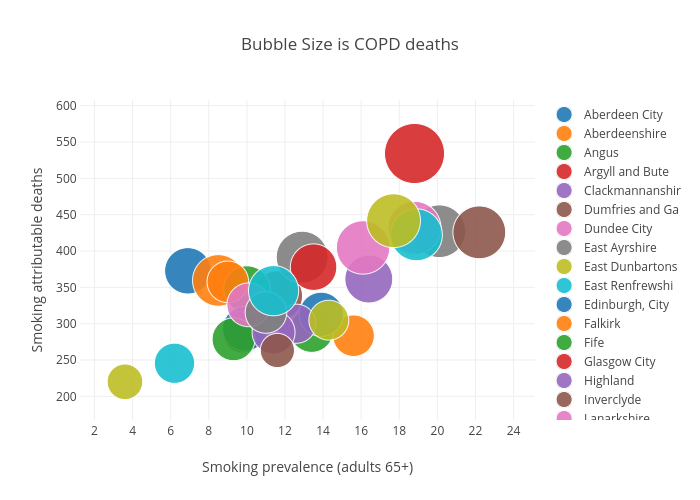
Billatnapier's interactive graph and data of "Bubble Size is COPD deaths" is a scatter chart, showing Aberdeen City, Aberdeenshire, Angus, Argyll and Bute, Clackmannanshir, Dumfries and Ga, Dundee City, East Ayrshire, East Dunbartons, East Renfrewshi, Edinburgh, City, Falkirk, Fife, Glasgow City, Highland, Inverclyde, Lanarkshire, Mid and East Lo, Moray, North Ayrshire, Orkney Islands, Outer Hebrides, Perth and Kinro, Renfrewshire, Scottish Border, Shetland Island, South Ayrshire, Stirling, West Dunbartons, West Lothian; with Smoking prevalence (adults 65+) in the x-axis and Smoking attributable deaths in the y-axis.. The x-axis shows values from 0 to 0. The y-axis shows values from 0 to 0.