Edit chart
Loading graph
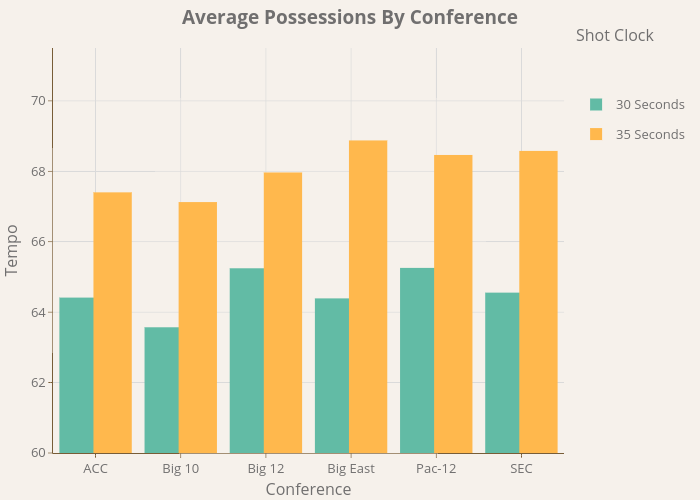
Bixby96's interactive graph and data of " Average Possessions By Conference " is a , showing 30 Seconds vs 35 Seconds; with Conference in the x-axis and Tempo in the y-axis.. The x-axis shows values from -0.5 to 5.5. The y-axis shows values from 60 to 71.50175438596494. This visualization has the following annotation: Shot Clock