Edit chart
Loading graph
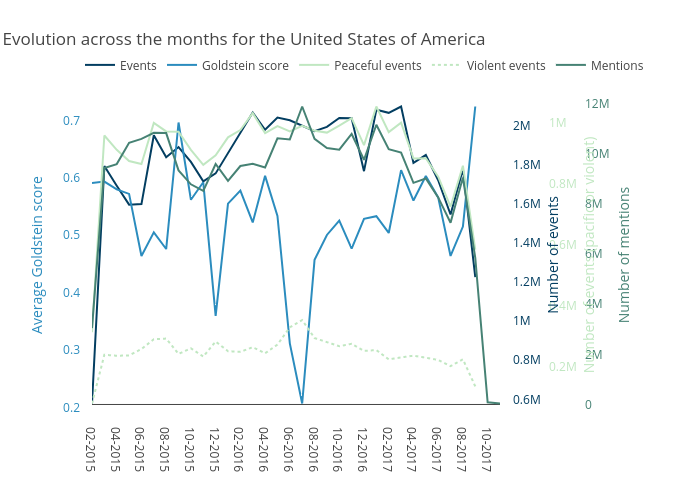
Bizeul1's interactive graph and data of "Evolution across the months for the United States of America " is a line chart, showing Events, Goldstein score, Peaceful events, Violent events, Mentions; with Number of events in the y-axis. The x-axis shows values from 0 to 33. The y-axis shows values from 494183.3888888889 to 2182835.611111111.