0
10M
20M
30M
40M
50M
60M
70M
80M
90M
Human Activity
(millions of events)
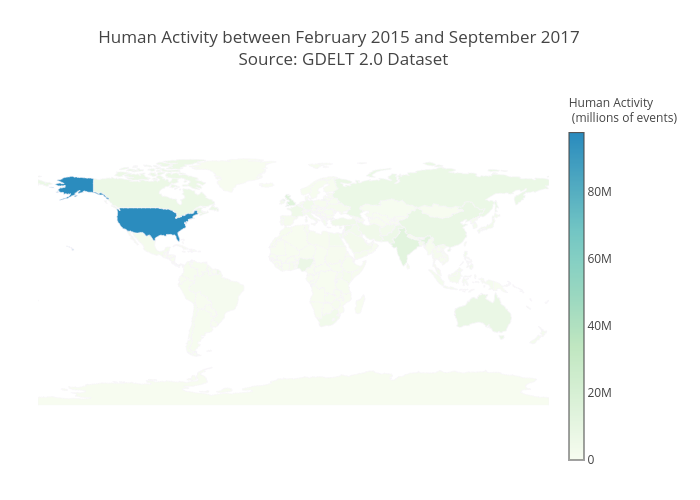
Human Activity between February 2015 and September 2017
Source: GDELT 2.0 Dataset
plotly-logomark
Edit chart
Bizeul1's interactive graph and data of "Human Activity between February 2015 and September 2017 Source: GDELT 2.0 Dataset " is a choropleth. The x-axis shows values from 0 to 0. The y-axis shows values from 0 to 0.