Edit chart
Loading graph
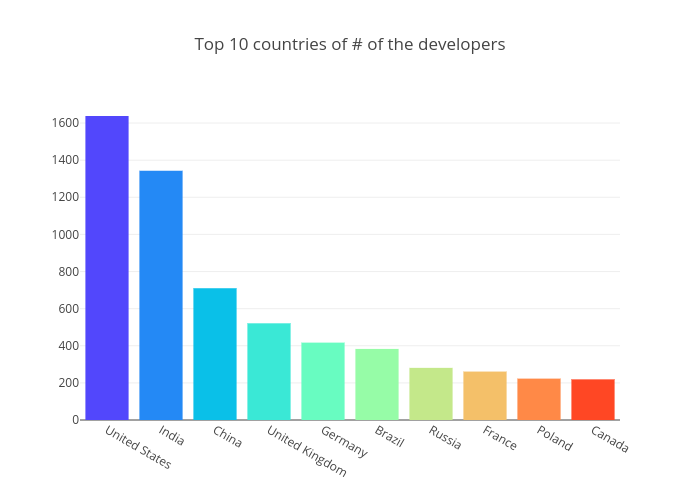
Bluekirin93's interactive graph and data of "Top 10 countries of # of the developers" is a bar chart. The x-axis shows values from 0 to 0. The y-axis shows values from 0 to 0.