Edit chart
Loading graph
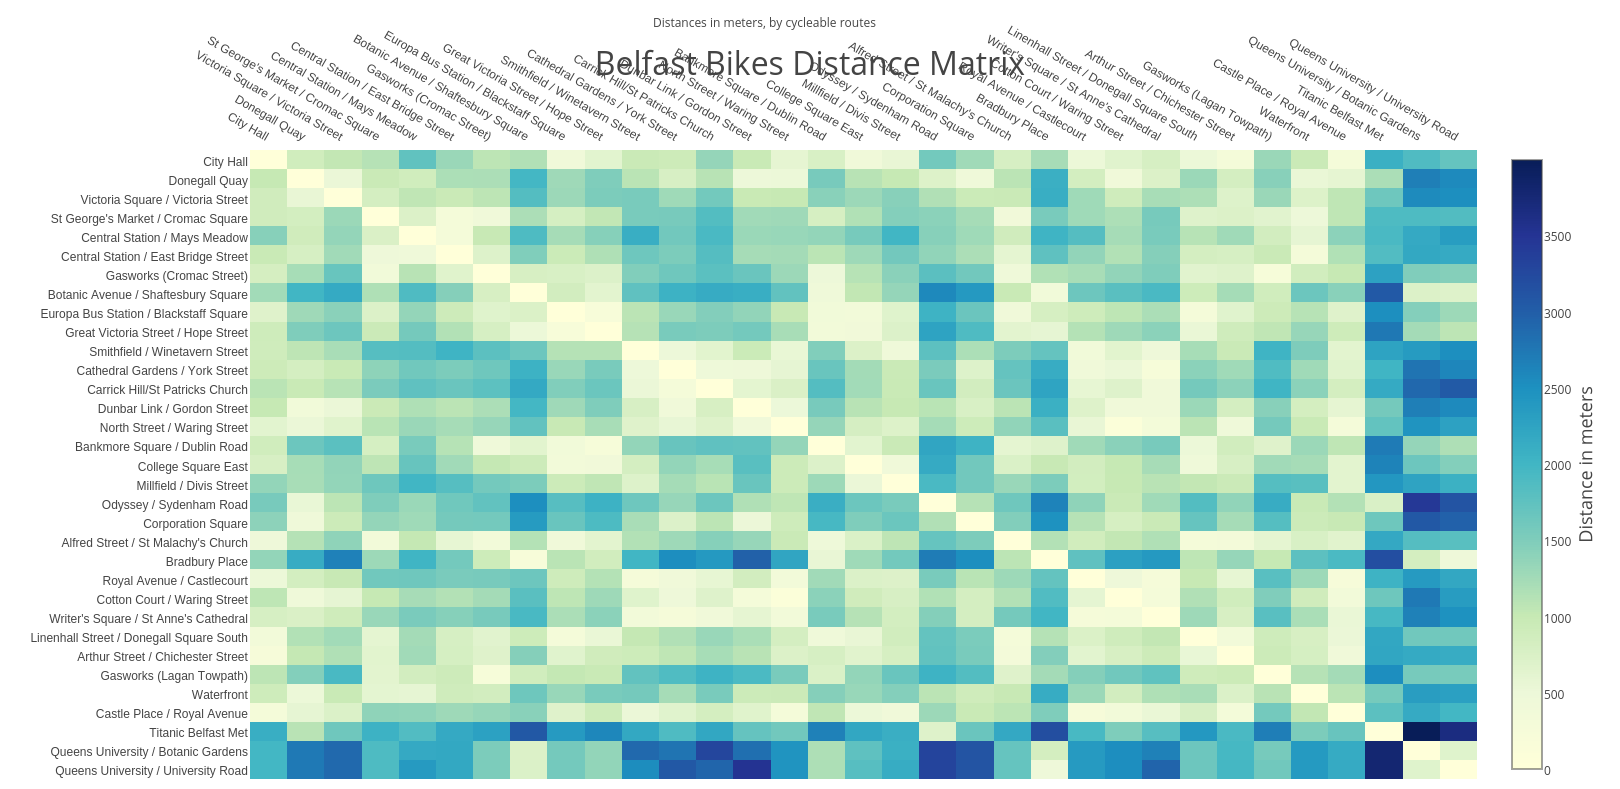
Bobharper's interactive graph and data of "Belfast Bikes Distance Matrix" is a heatmap, showing distance.meters. The x-axis shows values from -0.5 to 32.5. The y-axis shows values from 32.5 to -0.5. This visualization has the following annotation: Distances in meters, by cycleable routes