Edit chart
Loading graph
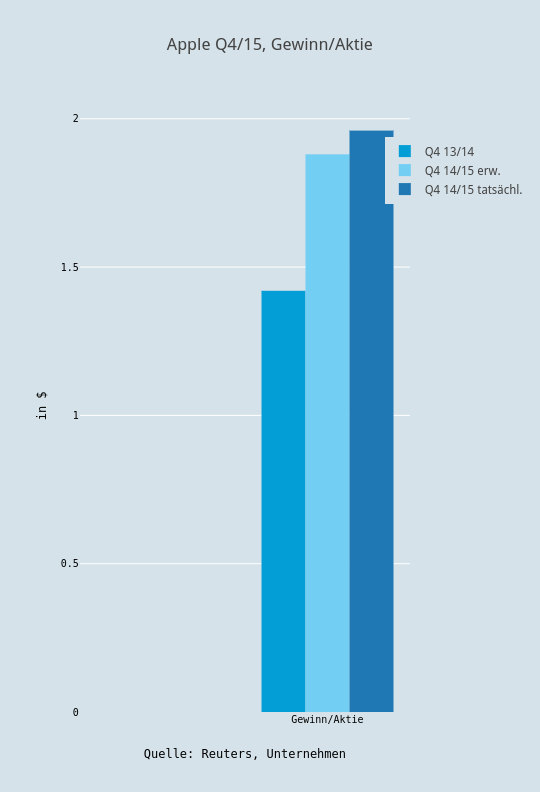
Boerse's interactive graph and data of "Apple Q4/15, Gewinn/Aktie" is a bar chart, showing Q4 13/14, Q4 14/15 erw., Q4 14/15 tatsächl.; with Quelle: Reuters, Unternehmen in the x-axis and in $ in the y-axis.. The x-axis shows values from 0.5 to 1.5. The y-axis shows values from 0 to 2.0631578947368423.