Edit chart
Loading graph
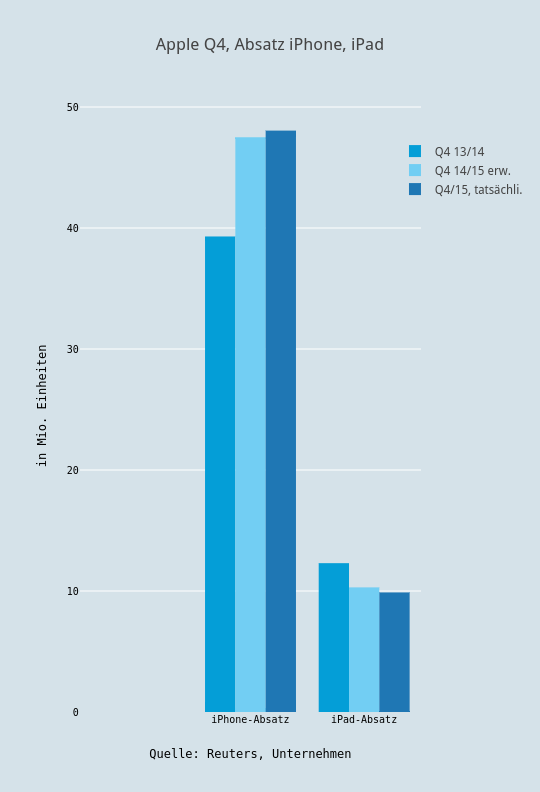
Boerse's interactive graph and data of "Apple Q4, Absatz iPhone, iPad" is a bar chart, showing Q4 13/14, Q4 14/15 erw., Q4/15, tatsächli.; with Quelle: Reuters, Unternehmen in the x-axis and in Mio. Einheiten in the y-axis.. The x-axis shows values from 0.5 to 2.5. The y-axis shows values from 0 to 50.57894736842105.