Edit chart
Loading graph
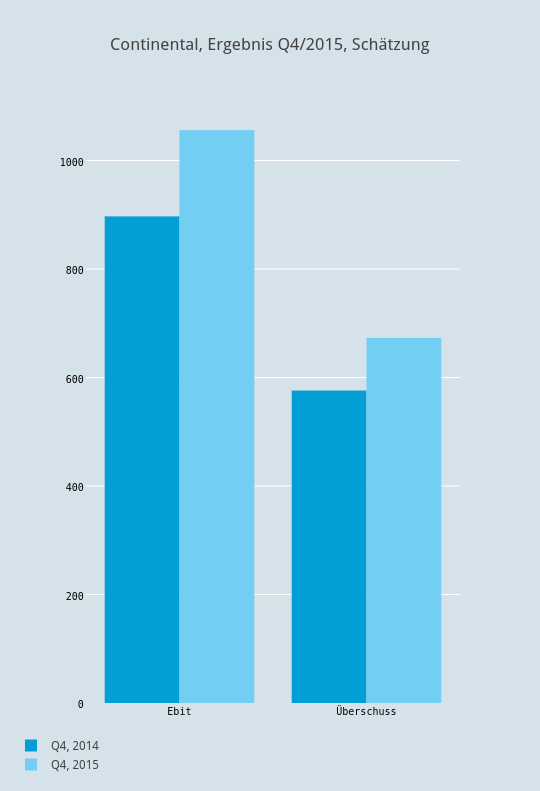
Boerse's interactive graph and data of "Continental, Ergebnis Q4/2015, Schätzung" is a bar chart, showing Q4, 2014 vs Q4, 2015. The x-axis shows values from 0.5 to 2.5. The y-axis shows values from 0 to 1111.578947368421.