Edit chart
Loading graph
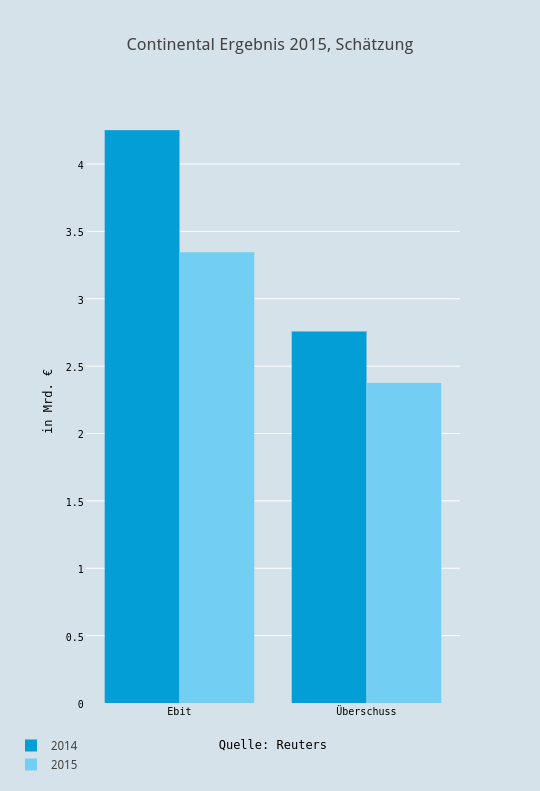
Boerse's interactive graph and data of "Continental Ergebnis 2015, Schätzung" is a bar chart, showing 2014 vs 2015; with Quelle: Reuters in the x-axis and in Mrd. € in the y-axis.. The x-axis shows values from 0.5 to 2.5. The y-axis shows values from 0 to 4.474736842105264.