Edit chart
Loading graph
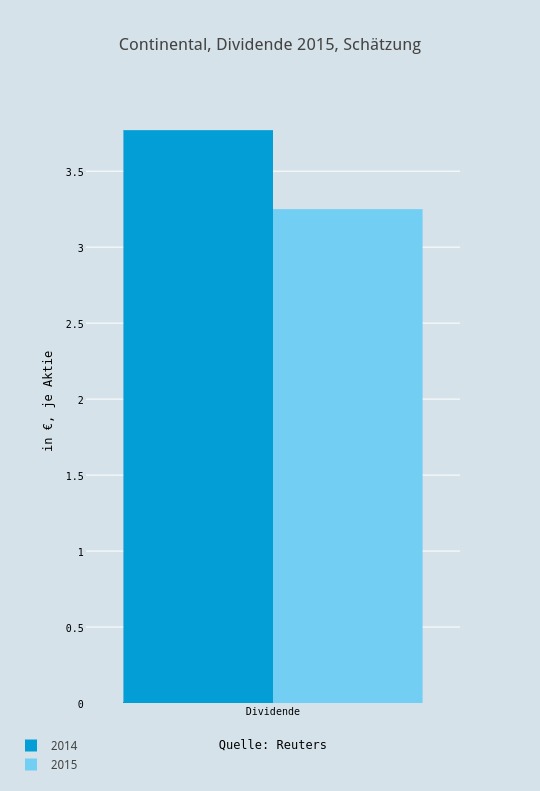
Boerse's interactive graph and data of "Continental, Dividende 2015, Schätzung" is a bar chart, showing 2014 vs 2015; with Quelle: Reuters in the x-axis and in €, je Aktie in the y-axis.. The x-axis shows values from 0.5 to 1.5. The y-axis shows values from 0 to 3.968421052631579.