Edit chart
Loading graph
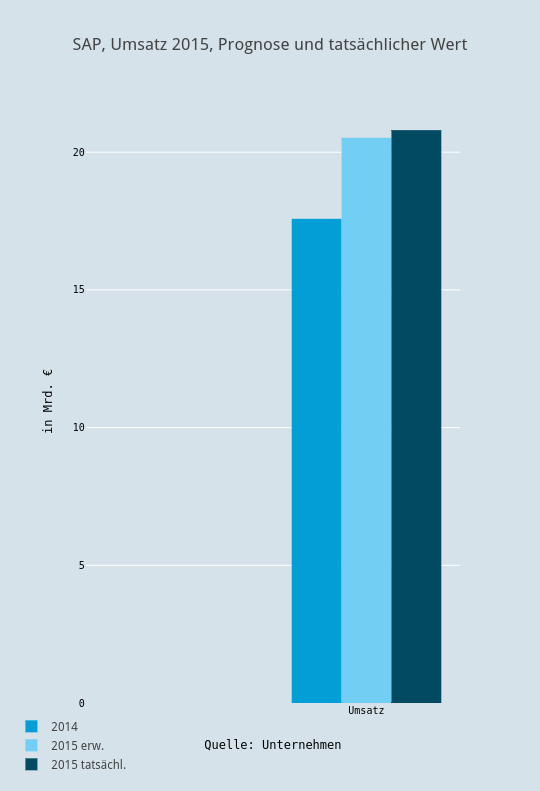
Boerse's interactive graph and data of "SAP, Umsatz 2015, Prognose und tatsächlicher Wert" is a bar chart, showing 2014, 2015 erw., 2015 tatsächl.; with Quelle: Unternehmen in the x-axis and in Mrd. € in the y-axis.. The x-axis shows values from 0.5 to 1.5. The y-axis shows values from 0 to 21.894736842105264.