Edit chart
Loading graph
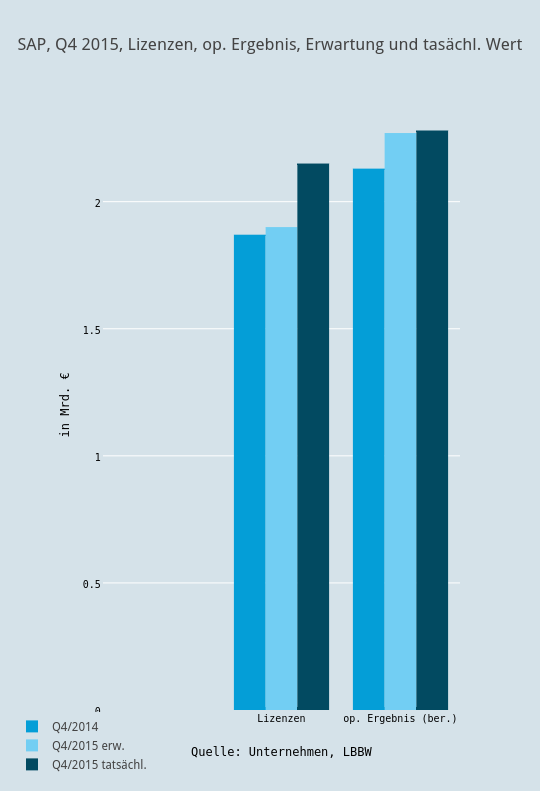
Boerse's interactive graph and data of "SAP, Q4 2015, Lizenzen, op. Ergebnis, Erwartung und tasächl. Wert" is a bar chart, showing Q4/2014, Q4/2015 erw., Q4/2015 tatsächl.; with Quelle: Unternehmen, LBBW in the x-axis and in Mrd. € in the y-axis.. The x-axis shows values from 1.5 to 3.5. The y-axis shows values from 0 to 2.4.