Edit chart
Loading graph
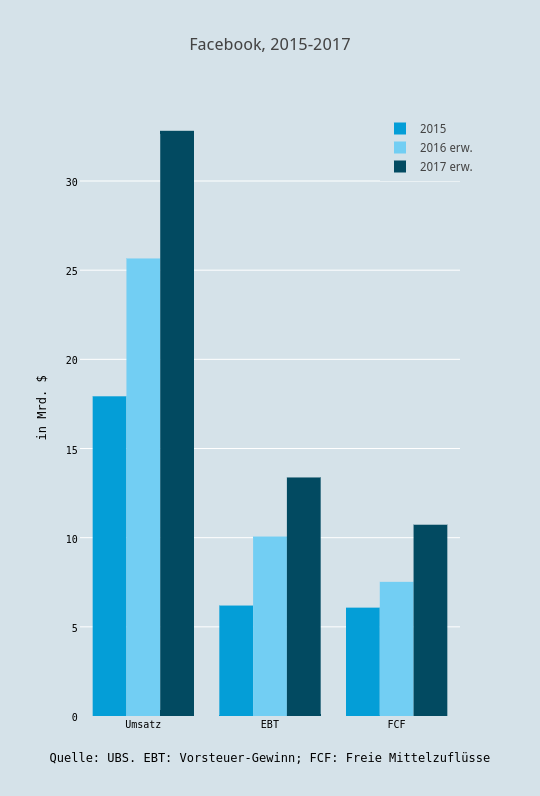
Boerse's interactive graph and data of "Facebook, 2015-2017" is a bar chart, showing 2015, 2016 erw., 2017 erw.; with Quelle: UBS. EBT: Vorsteuer-Gewinn; FCF: Freie Mittelzuflüsse in the x-axis and in Mrd. $ in the y-axis.. The x-axis shows values from 0.5 to 3.5. The y-axis shows values from 0 to 34.54210526315789.