Edit chart
Loading graph
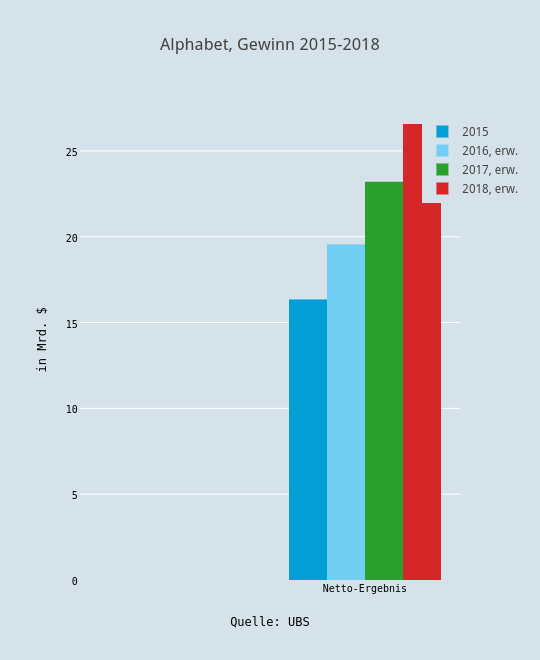
Boerse's interactive graph and data of "Alphabet, Gewinn 2015-2018" is a bar chart, showing 2015, 2016, erw., 2017, erw., 2018, erw.; with Quelle: UBS in the x-axis and in Mrd. $ in the y-axis.. The x-axis shows values from 0.5 to 1.5. The y-axis shows values from 0 to 27.966315789473686.