Edit chart
Loading graph
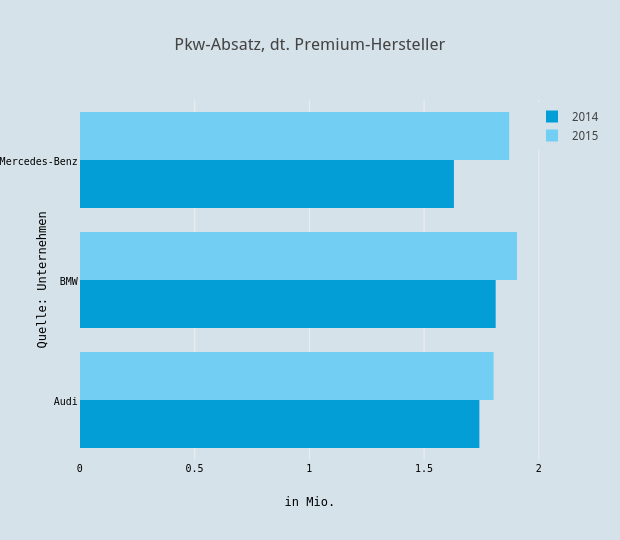
Boerse's interactive graph and data of "Pkw-Absatz, dt. Premium-Hersteller" is a grouped bar chart, showing 2014 vs 2015; with in Mio. in the x-axis and Quelle: Unternehmen in the y-axis.. The x-axis shows values from 0 to 2.005263157894737. The y-axis shows values from -0.5 to 2.5.