Edit chart
Loading graph
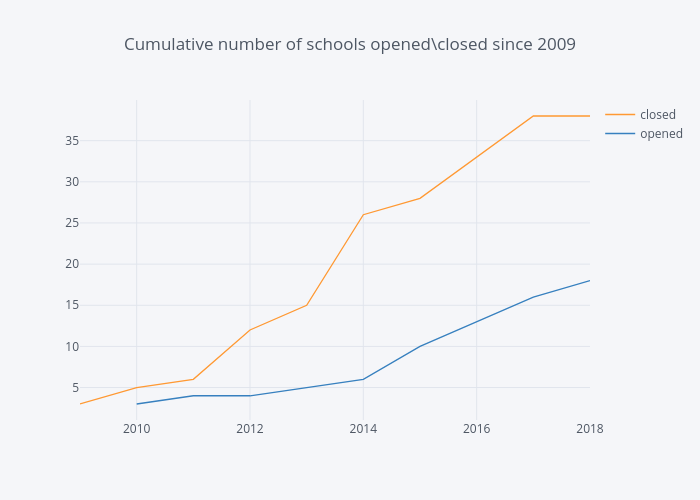
Bolster's interactive graph and data of "Cumulative number of schools opened\closed since 2009" is a line chart, showing closed vs opened. The x-axis shows values from 0 to 0. The y-axis shows values from 0 to 0.