Edit chart
Loading graph
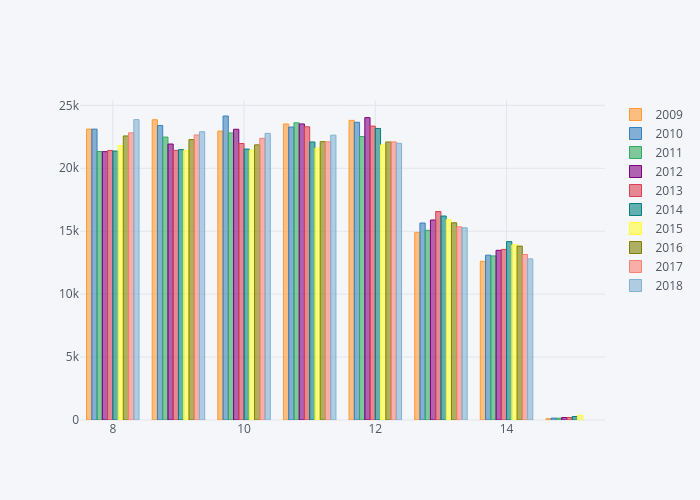
Bolster's interactive graph and data of "2009, 2010, 2011, 2012, 2013, 2014, 2015, 2016, 2017, 2018" is a bar chart, showing 2009, 2010, 2011, 2012, 2013, 2014, 2015, 2016, 2017, 2018. The x-axis shows values from 0 to 0. The y-axis shows values from 0 to 0.