Edit chart
Loading graph
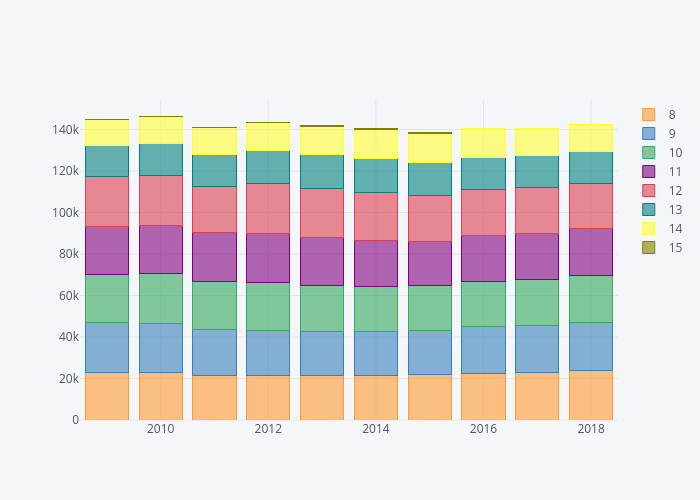
Bolster's interactive graph and data of "8, 9, 10, 11, 12, 13, 14, 15" is a stacked bar chart, showing 8, 9, 10, 11, 12, 13, 14, 15. The x-axis shows values from 0 to 0. The y-axis shows values from 0 to 0.