Edit chart
Loading graph
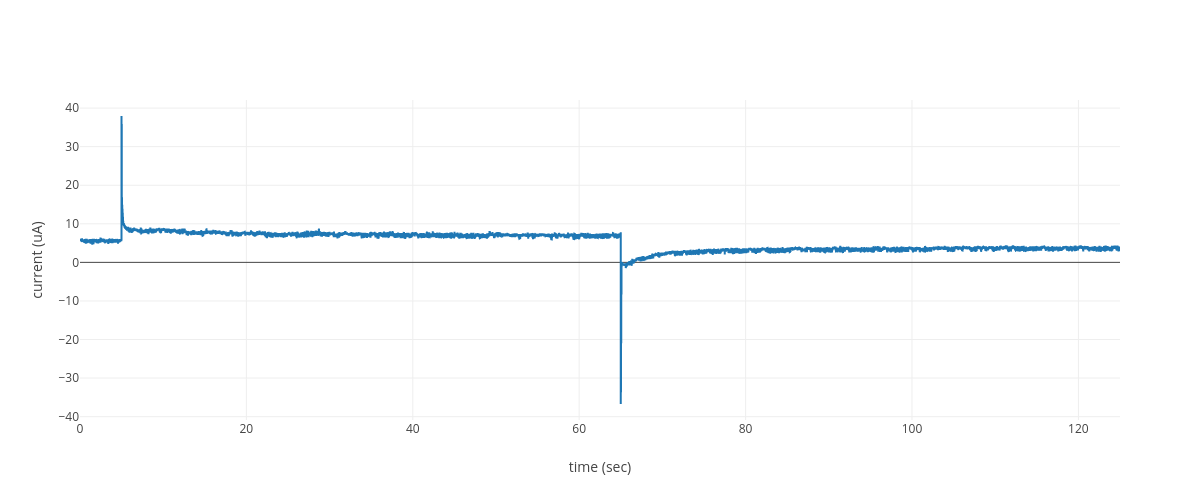
Boroomand.saeed's interactive graph and data of "current (uA) vs time (sec)" is a scatter chart; with time (sec) in the x-axis and current (uA) in the y-axis.. The x-axis shows values from 0.005 to 125. The y-axis shows values from -40.86992888888889 to 42.09484888888889.