Edit chart
Loading graph
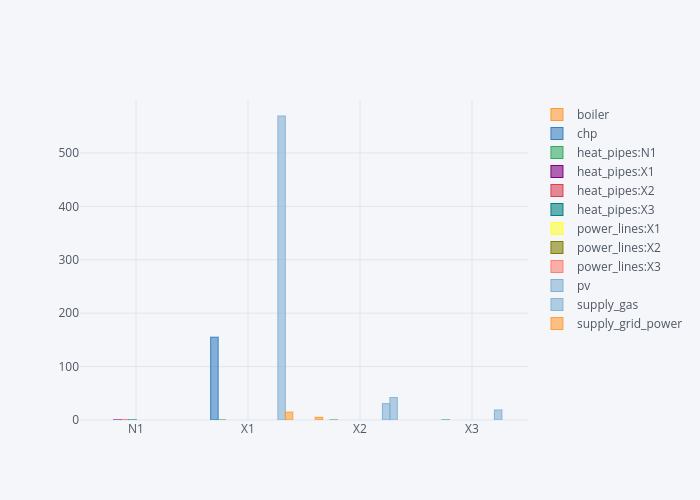
Bp325's interactive graph and data of "boiler, chp, heat_pipes:N1, heat_pipes:X1, heat_pipes:X2, heat_pipes:X3, power_lines:X1, power_lines:X2, power_lines:X3, pv, supply_gas, supply_grid_power" is a bar chart, showing boiler, chp, heat_pipes:N1, heat_pipes:X1, heat_pipes:X2, heat_pipes:X3, power_lines:X1, power_lines:X2, power_lines:X3, pv, supply_gas, supply_grid_power. The x-axis shows values from 0 to 0. The y-axis shows values from 0 to 0.