Edit chart
Loading graph
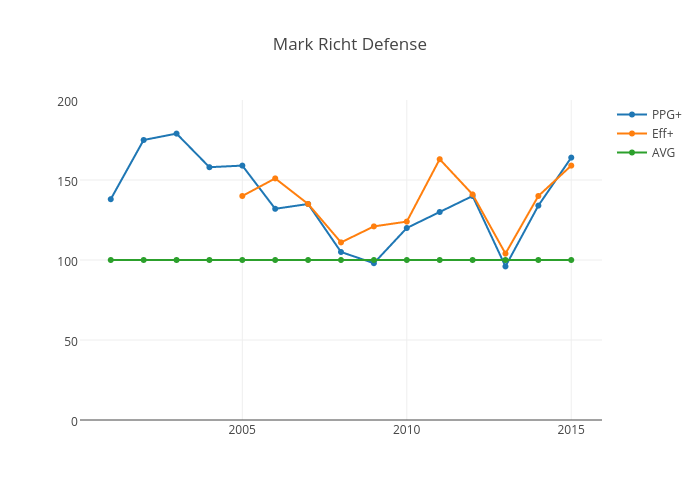
Brent.h.blackwell's interactive graph and data of "Mark Richt Defense" is a scatter chart, showing PPG+, Eff+, AVG. The x-axis shows values from 2000.1266859344894 to 2015.8733140655106. The y-axis shows values from 0 to 200.