Edit chart
Loading graph
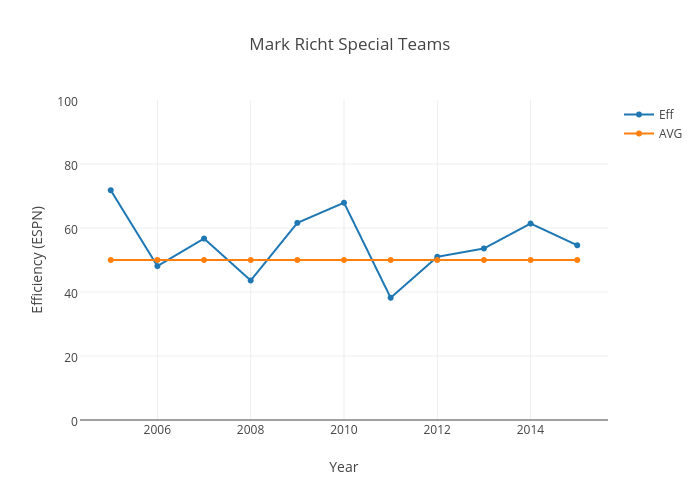
Brent.h.blackwell's interactive graph and data of "Mark Richt Special Teams" is a scatter chart, showing Eff vs AVG; with Year in the x-axis and Efficiency (ESPN) in the y-axis.. The x-axis shows values from 2004.381418676857 to 2015.618581323143. The y-axis shows values from 0 to 100.