Edit chart
Loading graph
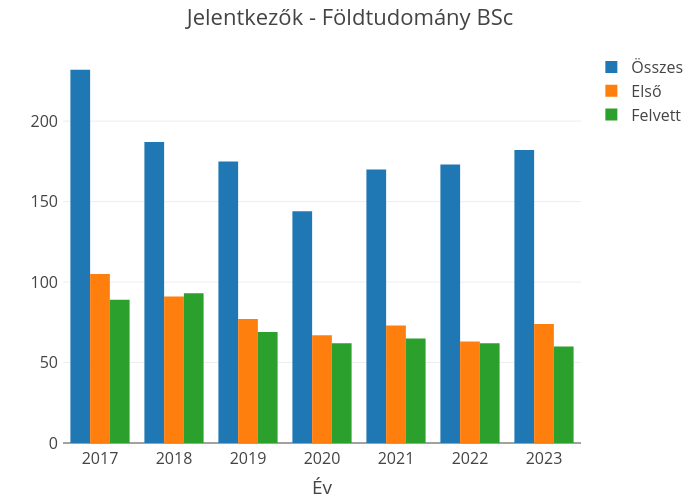
Breuer.hajni's interactive graph and data of "Jelentkezők - Földtudomány BSc" is a bar chart, showing Összes, Első, Felvett; with Év in the x-axis. The x-axis shows values from 0 to 0. The y-axis shows values from 0 to 0.