Edit chart
Loading graph
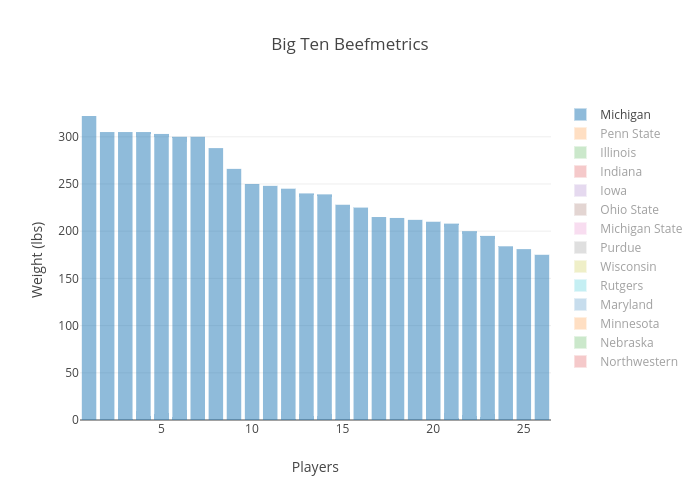
Brianeisinger's interactive graph and data of "Big Ten Beefmetrics" is a overlaid bar chart, showing Michigan, Penn State, Illinois, Indiana, Iowa, Ohio State, Michigan State, Purdue, Wisconsin, Rutgers, Maryland, Minnesota, Nebraska, Northwestern; with Players in the x-axis and Weight (lbs) in the y-axis.. The x-axis shows values from 0 to 0. The y-axis shows values from 0 to 0.