Edit chart
Loading graph
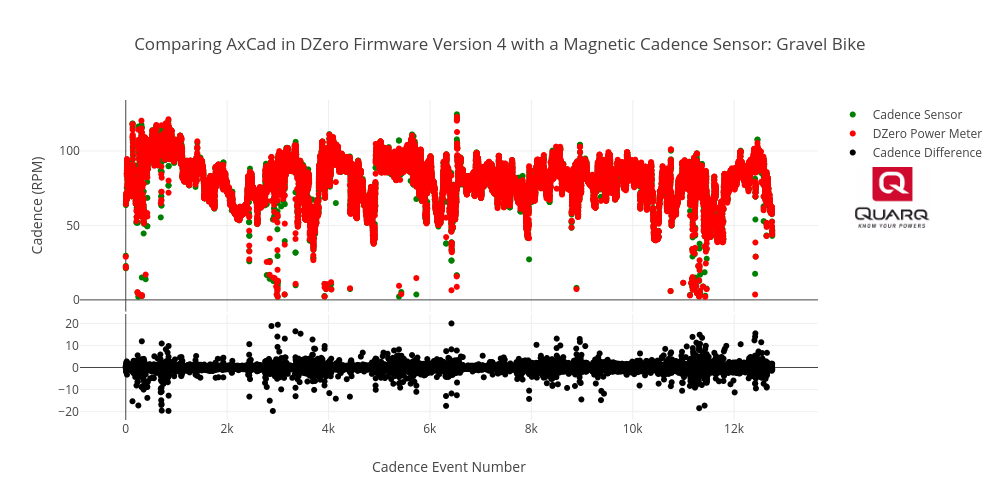
Brjasinski's interactive graph and data of "Comparing AxCad in DZero Firmware Version 4 with a Magnetic Cadence Sensor: Gravel Bike" is a scatter chart, showing Cadence Sensor, DZero Power Meter, Cadence Difference; with Cadence Event Number in the x-axis and Cadence (RPM) in the y-axis.. The x-axis shows values from 0 to 0. The y-axis shows values from 0 to 0.