Edit chart
Loading graph
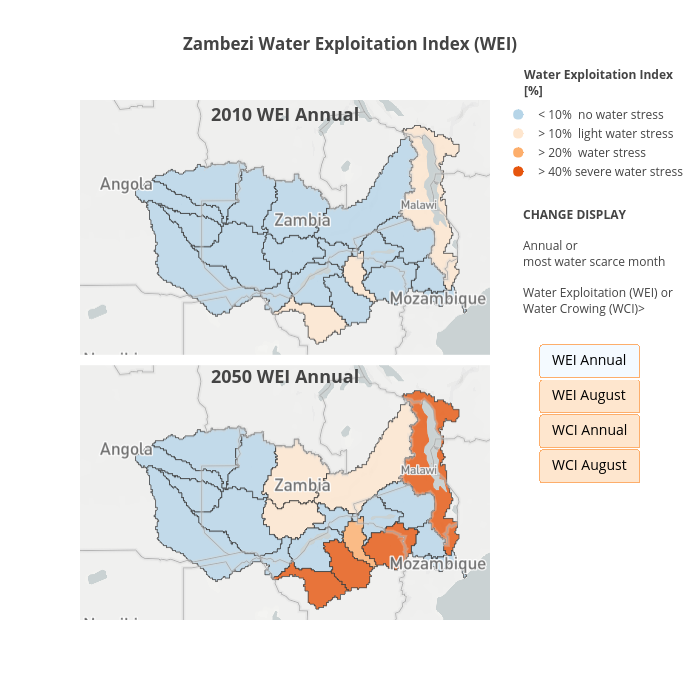
Bupe's interactive graph and data of "Zambezi Water Exploitation Index (WEI)" is a scattermapbox, showing 10% light water stress, > 20% water stress, > 40% severe water stress. The x-axis shows values from 0 to 0. The y-axis shows values from 0 to 0. This visualization has the following annotations: CHANGE DISPLAYAnnual ormost water scarce monthWater Exploitation (WEI) orWater Crowing (WCI)>; Water Exploitation Index[%]; 2010 WEI Annual; 2050 WEI Annual