Edit chart
Loading graph
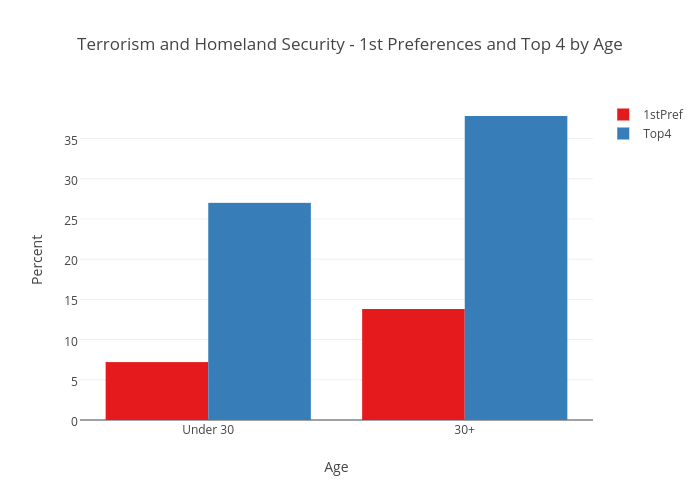
Busbyj's interactive graph and data of "Terrorism and Homeland Security - 1st Preferences and Top 4 by Age" is a bar chart, showing 1stPref vs Top4; with Age in the x-axis and Percent in the y-axis.. The x-axis shows values from -0.5 to 1.5. The y-axis shows values from 0 to 39.78947368421052.