Edit chart
Loading graph
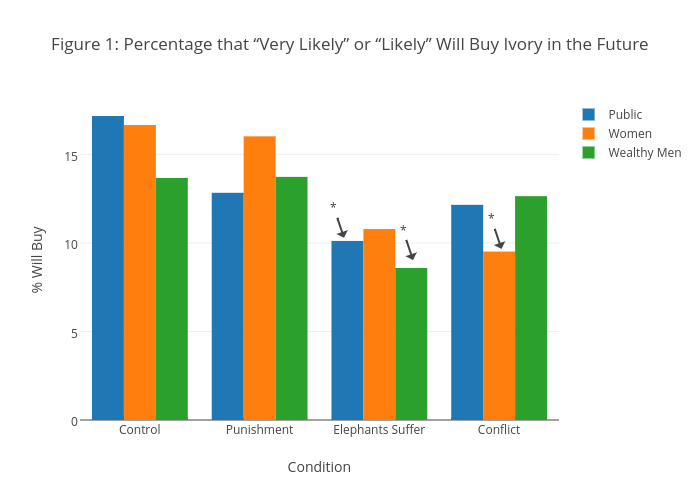
Busbyj's interactive graph and data of "Figure 1: Percentage that “Very Likely” or “Likely” Will Buy Ivory in the Future" is a bar chart, showing Public, Women, Wealthy Men; with Condition in the x-axis and % Will Buy in the y-axis.. The x-axis shows values from -0.5 to 3.5. The y-axis shows values from 0 to 18.08421052631579. This visualization has the following annotations: *; *; *