Edit chart
Loading graph
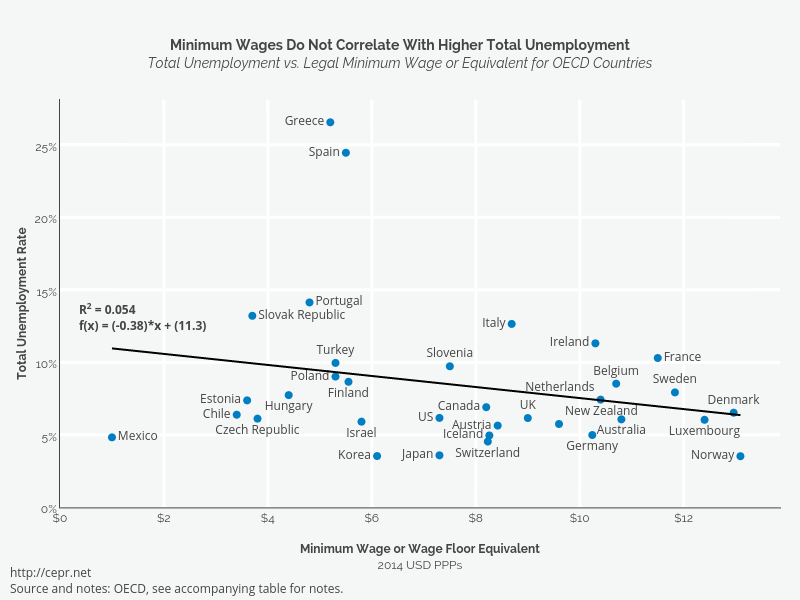
Cashmank's interactive graph and data of "Minimum Wages Do Not Correlate With Higher Total UnemploymentTotal Unemployment vs. Legal Minimum Wage or Equivalent for OECD Countries" is a , showing 6.07%, 5.64%, 8.53%, 6.91%, 6.39%, 6.12%, 6.53%, 7.38%, 8.66%, 10.30%, 4.99%, 26.55%, 7.74%, 4.96%, 11.31%, 5.91%, 12.65%, 3.59%, 3.54%, 6.04%, 4.83%, 7.43%, 5.75%, 3.53%, 9.02%, 14.13%, 13.21%, 9.73%, 24.45%, 7.93%, 4.54%, 9.96%, 6.16%, 6.17%, Total Unemployment - fit; with Minimum Wage or Wage Floor Equivalent2014 USD PPPs in the x-axis and Total Unemployment Rate in the y-axis.. The x-axis shows values from 0 to 13.851413682522715. The y-axis shows values from 0 to 28.087773279352227. This visualization has the following annotations: http://cepr.netSource and notes: OECD, see accompanying table for notes.; R2 = 0.054f(x) = (-0.38)*x + (11.3)