Edit chart
Loading graph
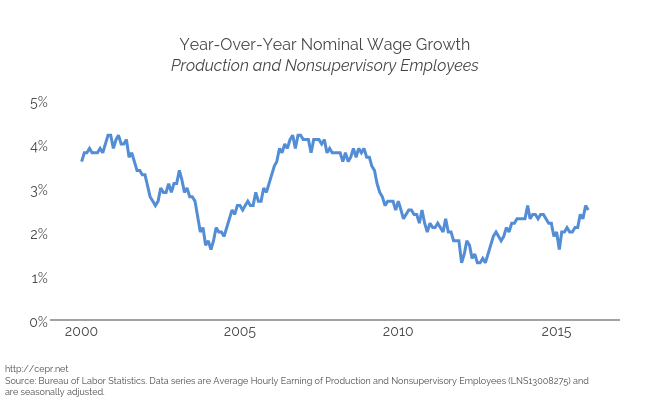
Cashmank's interactive graph and data of "Year-Over-Year Nominal Wage GrowthProduction and Nonsupervisory Employees" is a scatter chart, showing Year-Over-Year Nominal Wage Growth; with time in the x-axis. The x-axis shows values from 915166800000 to 1483246800000. The y-axis shows values from 0 to 5. This visualization has the following annotation: http://cepr.netSource: Bureau of Labor Statistics. Data series are Average Hourly Earning of Production and Nonsupervisory Employees (LNS13008275) andare seasonally adjusted.