Edit chart
Loading graph
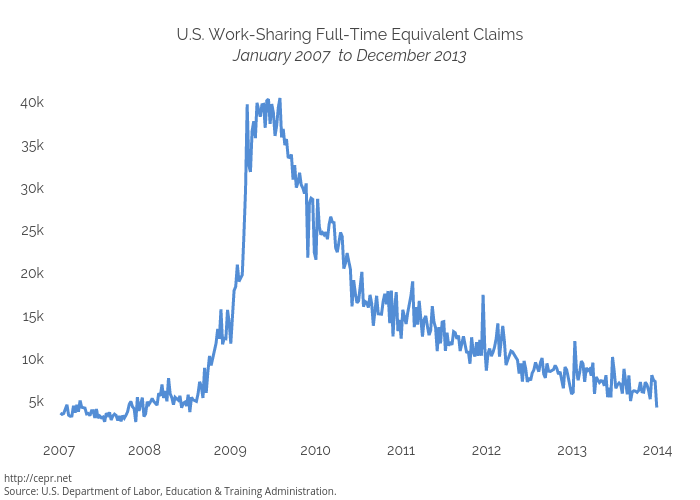
Cashmank's interactive graph and data of "U.S. Work-Sharing Full-Time Equivalent ClaimsJanuary 2007 to December 2013" is a scatter chart, showing Work-sharing Full-time Equivalent Claims, U.S., Jan. 2007 - Dec. 2013; with time in the x-axis. The x-axis shows values from 1162353600000 to 1391230800000. The y-axis shows values from 509.2777777777778 to 42603.72222222222. This visualization has the following annotation: http://cepr.netSource: U.S. Department of Labor, Education & Training Administration.