Edit chart
Loading graph
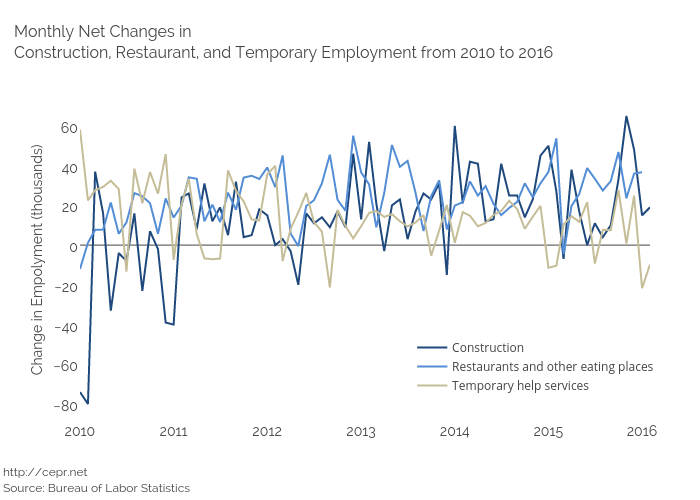
Cashmank's interactive graph and data of "Change in Empolyment (thousands) vs time" is a scatter chart, showing Construction, Restaurants and other eating places, Temporary help services; with time in the x-axis and Change in Empolyment (thousands) in the y-axis.. The x-axis shows values from 1262322000000 to 1451624400000. The y-axis shows values from -88.05555555555556 to 73.05555555555556. This visualization has the following annotations: http://cepr.netSource: Bureau of Labor Statistics; Monthly Net Changes inConstruction, Restaurant, and Temporary Employment from 2010 to 2016