Edit chart
Loading graph
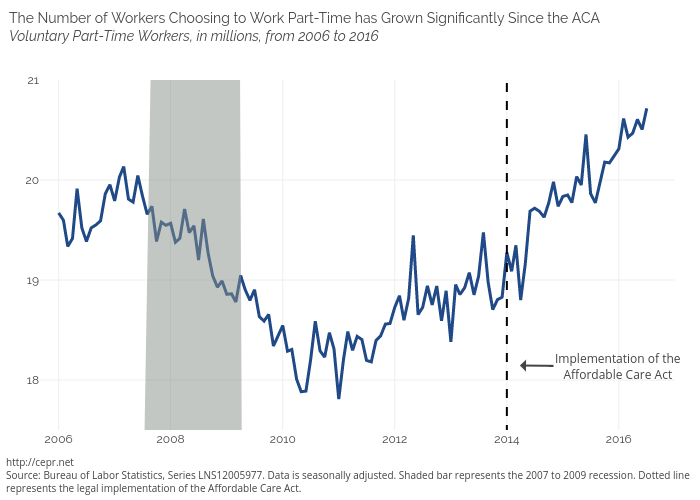
Cashmank's interactive graph and data of "Voluntary, Col1, Col2" is a scatter chart, showing Voluntary, Col1, Col2. The x-axis shows values from 1125547200000 to 1483246800000. The y-axis shows values from 17500 to 21000. This visualization has the following annotations: LNS12005977. Data is seasonally adjusted. Shaded bar represents the 2007 to 2009 recession. Dotted linerepresents the legal implementation of the Affordable Care Act. ; The Number of Workers Choosing to Work Part-Time has Grown Significantly Since the ACAVoluntary Part-Time Workers, in millions, from 2006 to 2016; Implementation of theAffordable Care Act