Edit chart
Loading graph
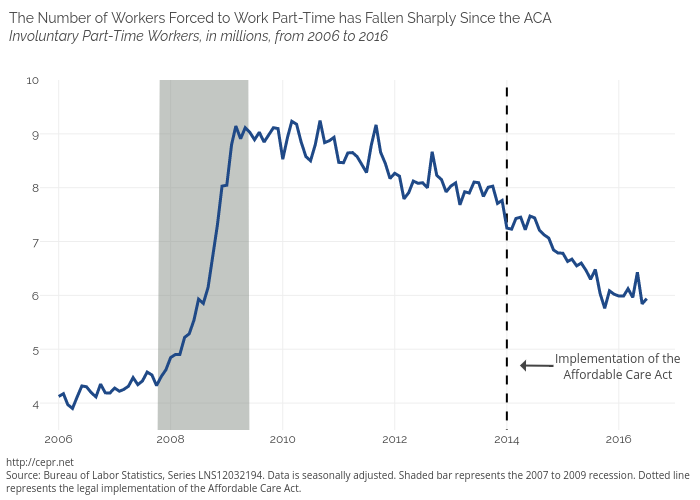
Cashmank's interactive graph and data of "Col1, Col2, Involuntary" is a filled , showing Col1, Col2, Involuntary. The x-axis shows values from 1125547200000 to 1483246800000. The y-axis shows values from 3500 to 10000. This visualization has the following annotations: LNS12032194. Data is seasonally adjusted. Shaded bar represents the 2007 to 2009 recession. Dotted linerepresents the legal implementation of the Affordable Care Act. ; The Number of Workers Forced to Work Part-Time has Fallen Sharply Since the ACAInvoluntary Part-Time Workers, in millions, from 2006 to 2016; Implementation of theAffordable Care Act