1990
1995
2000
2005
2010
2015
72%
74%
76%
78%
80%
82%
84%
http://cepr.net
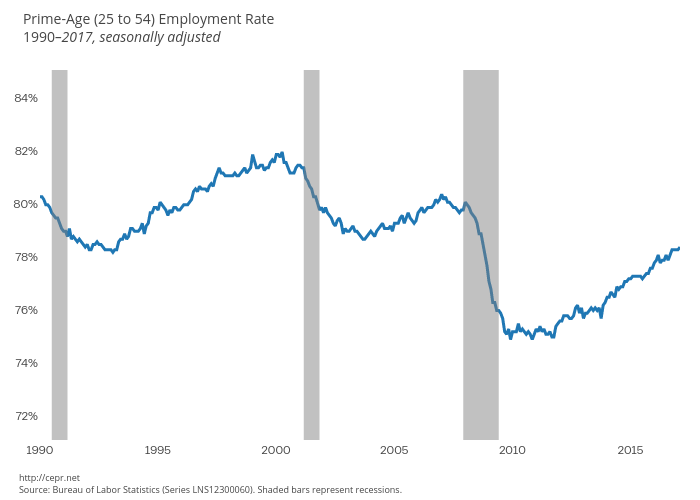
Source: Bureau of Labor Statistics (
Series LNS12300060
). Shaded bars represent recessions.
Prime-Age (25 to 54) Employment Rate
1990
–2017, seasonally adjusted
plotly-logomark
Edit chart
Cashmank's interactive graph and data of "y, Col2, C" is a scatter chart, showing y, Col2, C. The x-axis shows values from 1990-01-01 to 2017-02-01. The y-axis shows values from 71 to 85. This visualization has the following annotations: Series LNS12300060). Shaded bars represent recessions.; Prime-Age (25 to 54) Employment Rate1990–2017, seasonally adjusted