Edit chart
Loading graph
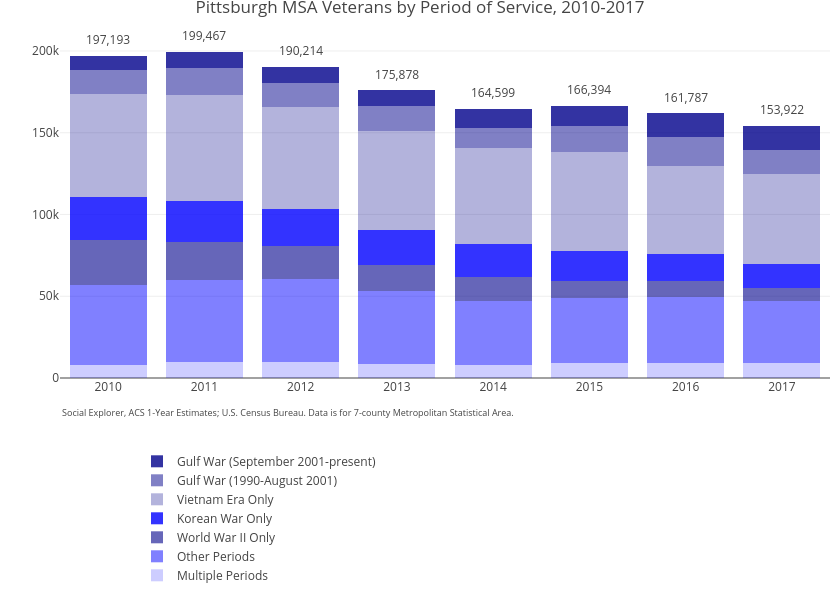
Cbriem's interactive graph and data of "Pittsburgh MSA Veterans by Period of Service, 2010-2017" is a stacked bar chart, showing Multiple Periods, Other Periods, World War II Only, Korean War Only, Vietnam Era Only, Gulf War (1990-August 2001), Gulf War (September 2001-present). The x-axis shows values from 0 to 0. The y-axis shows values from 0 to 0. This visualization has the following annotations: Social Explorer, ACS 1-Year Estimates; U.S. Census Bureau. Data is for 7-county Metropolitan Statistical Area.; 153,922; 161,787; 166,394; 164,599; 175,878; 190,214; 199,467; 197,193