Edit chart
Loading graph
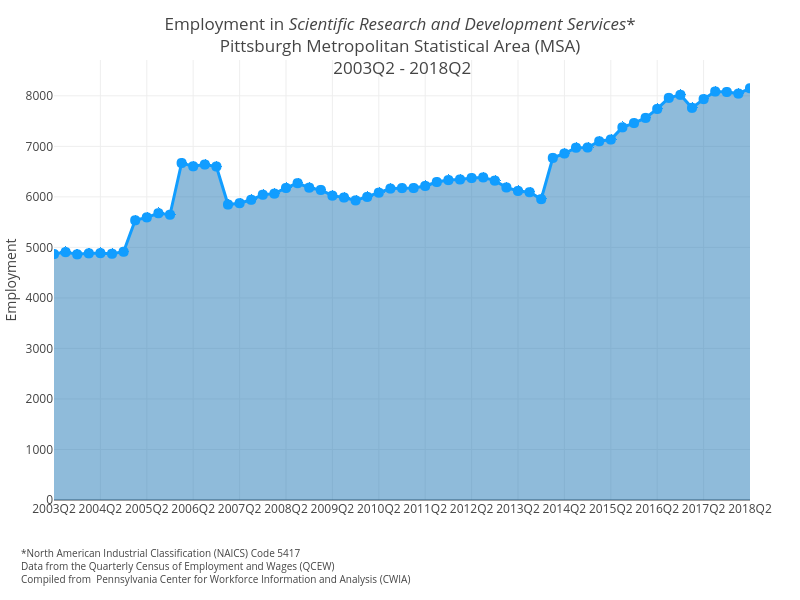
Cbriem's interactive graph and data of "Employment in Scientific Research and Development Services*Pittsburgh Metropolitan Statistical Area (MSA) 2003Q2 - 2018Q2" is a filled line chart; with Employment in the y-axis. The x-axis shows values from 0 to 0. The y-axis shows values from 0 to 0. This visualization has the following annotation: *North American Industrial Classification (NAICS) Code 5417Data from the Quarterly Census of Employment and Wages (QCEW)Compiled from Pennsylvania Center for Workforce Information and Analysis (CWIA)