Edit chart
Loading graph
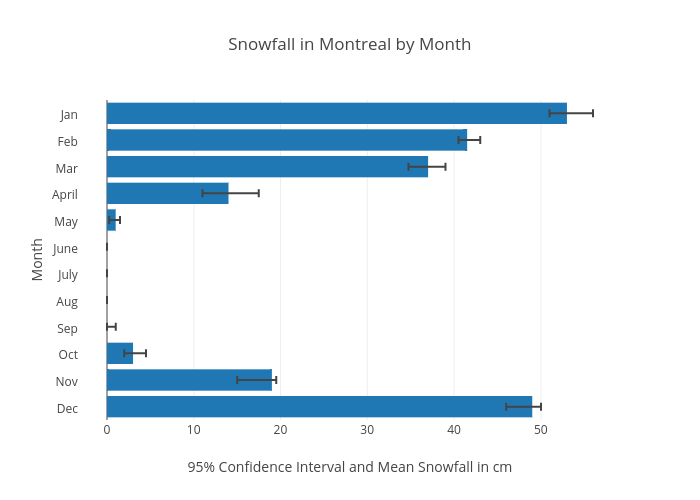
Chelsea_lyn's interactive graph and data of "Snowfall in Montreal by Month" is a bar chart; with 95% Confidence Interval and Mean Snowfall in cm in the x-axis and Month in the y-axis.. The x-axis shows values from 0 to 0. The y-axis shows values from 0 to 0.