Edit chart
Loading graph
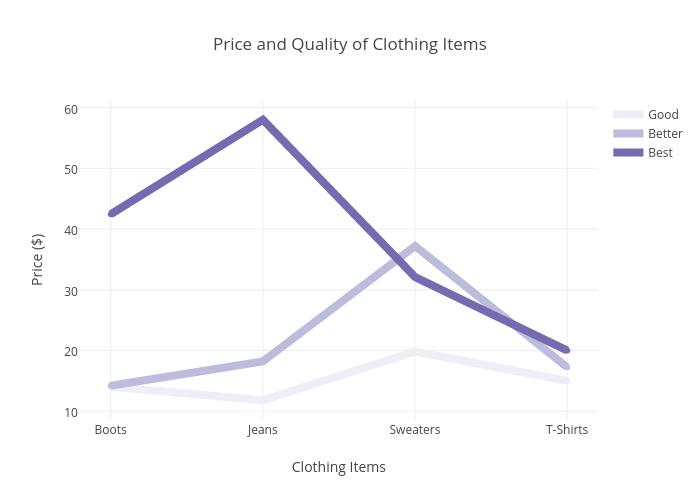
Chelsea_lyn's interactive graph and data of "Price and Quality of Clothing Items" is a line chart, showing Good, Better, Best; with Clothing Items in the x-axis and Price ($) in the y-axis.. The x-axis shows values from 0 to 0. The y-axis shows values from 0 to 0.