Edit chart
Loading graph
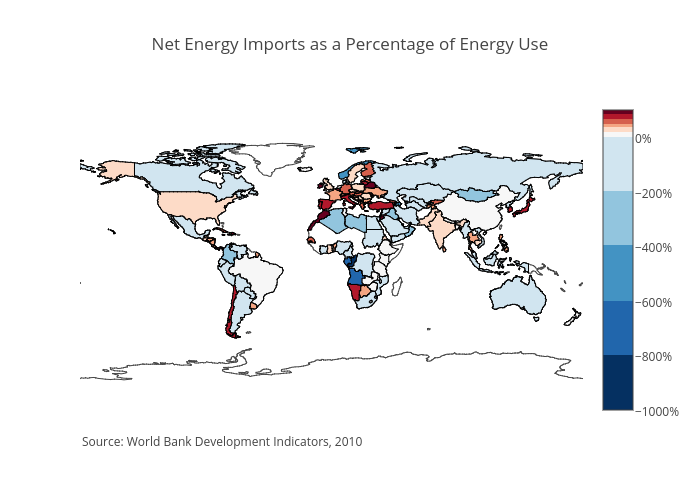
Chris's interactive graph and data of "Net Energy Imports as a Percentage of Energy Use" is a choropleth. The x-axis shows values from 0 to 0. The y-axis shows values from 0 to 0. This visualization has the following annotation: Source: World Bank Development Indicators, 2010