Edit chart
Loading graph
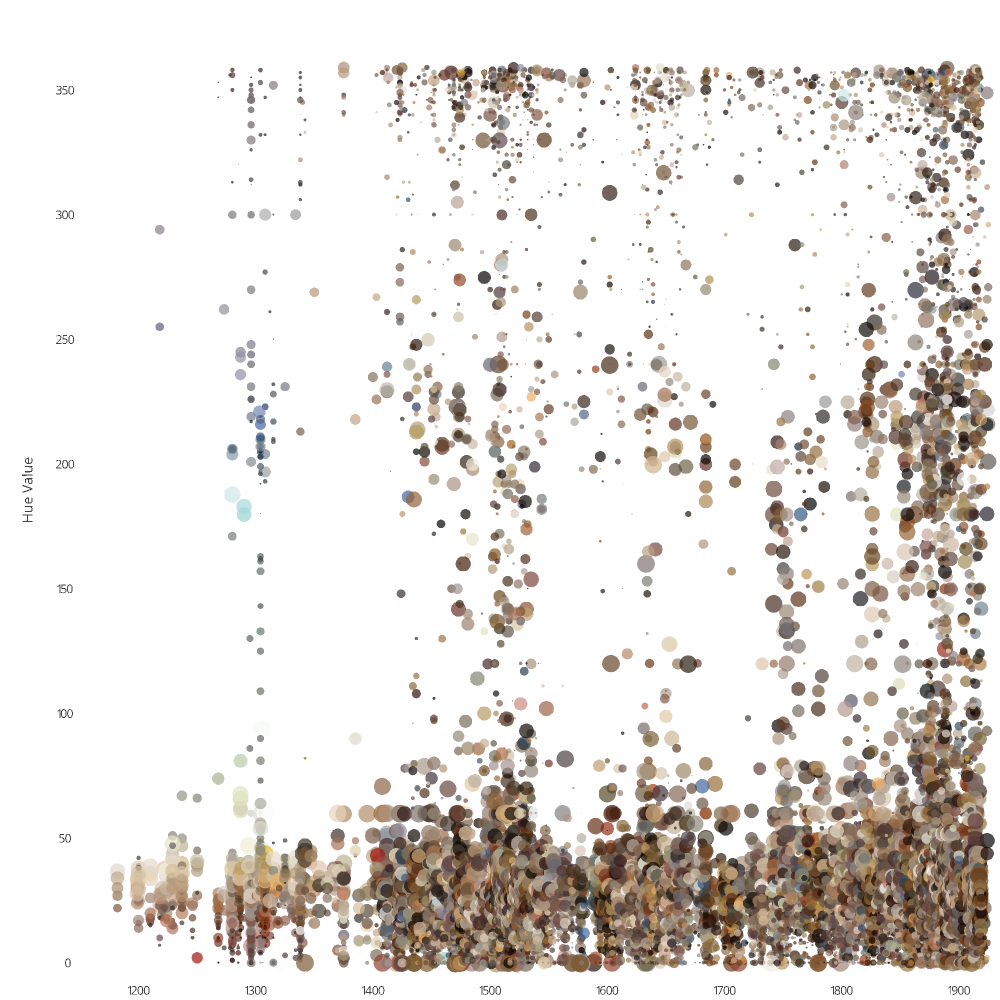
Chris's interactive graph and data of "Hue Value vs Year" is a scattergl, showing trace_0, trace 1, trace 2, trace3_Hue Value, trace4_Hue Value; with Year in the x-axis and Hue Value in the y-axis.. The x-axis shows values from 1150 to 1935. The y-axis shows values from -5 to 383.9891819727484. This visualization has the following annotation: Master Painter Color Choices Throughout History