Edit chart
Loading graph
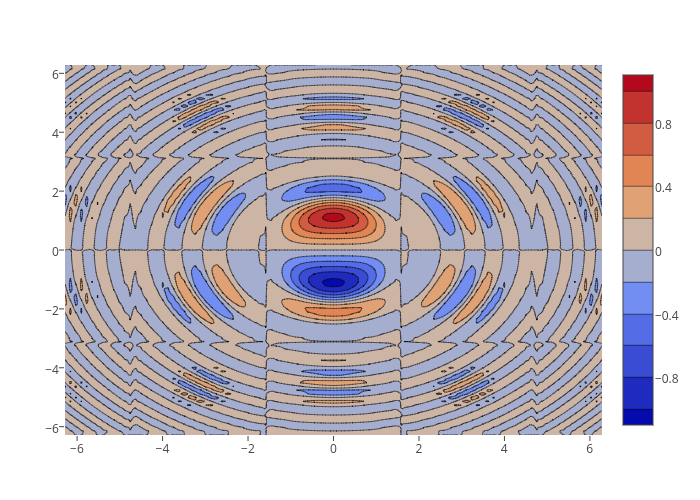
Chris's interactive graph and data is a contour. The x-axis shows values from -6.283185307179586 to 6.283185307179586. The y-axis shows values from -6.283185307179586 to 6.283185307179586.