Edit chart
Loading graph
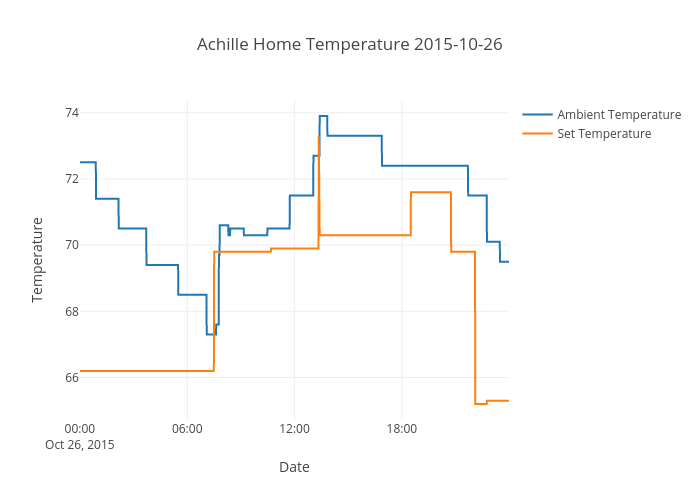
Chrisachille's interactive graph and data of "Achille Home Temperature 2015-10-26" is a scatter chart, showing Ambient Temperature vs Set Temperature; with Date in the x-axis and Temperature in the y-axis.. The x-axis shows values from 0 to 0. The y-axis shows values from 0 to 0.