Edit chart
Loading graph
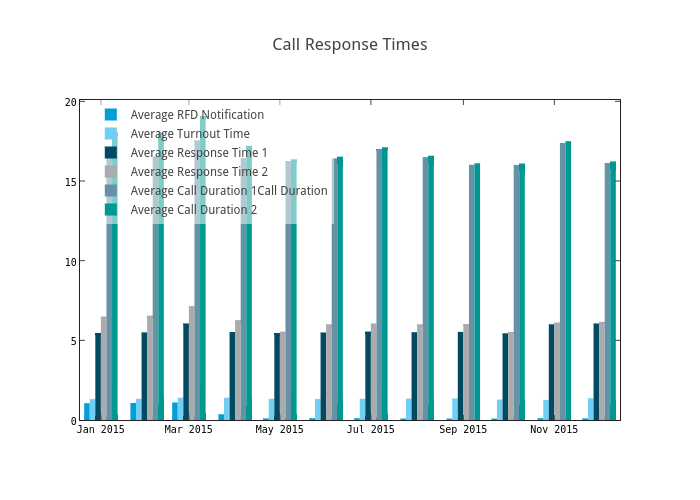
Chrismetcalf's interactive graph and data of "Call Response Times" is a bar chart, showing Average RFD Notification, Average Turnout Time, Average Response Time 1, Average Response Time 2, Average Call Duration 1Call Duration, Average Call Duration 2; with time in the x-axis. The x-axis shows values from 1418878800000 to 1450155600000. The y-axis shows values from 0 to 20.084210526315786.